| The Rip |
At one flank old Tasman the boar slashes and tears
And the other Pacific's sheer Mountainous anger devours.
Denis Glover
|
| |
| |
|
|
| |
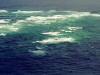
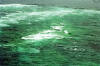
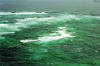
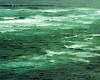
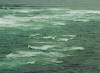
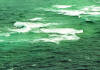
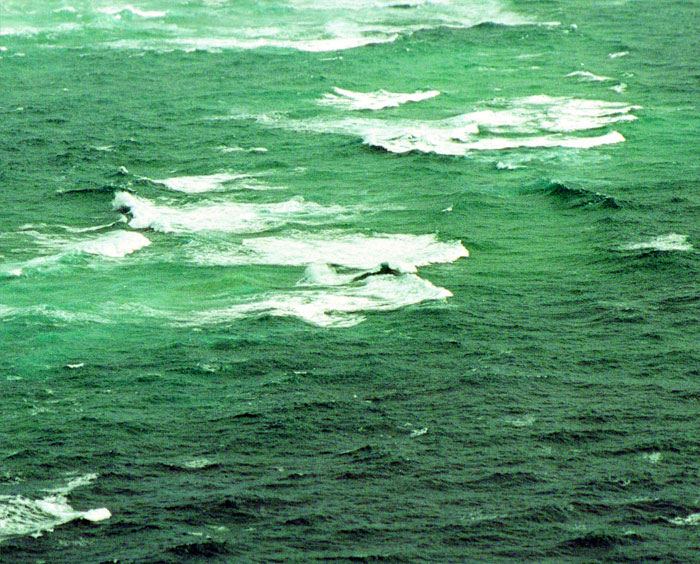
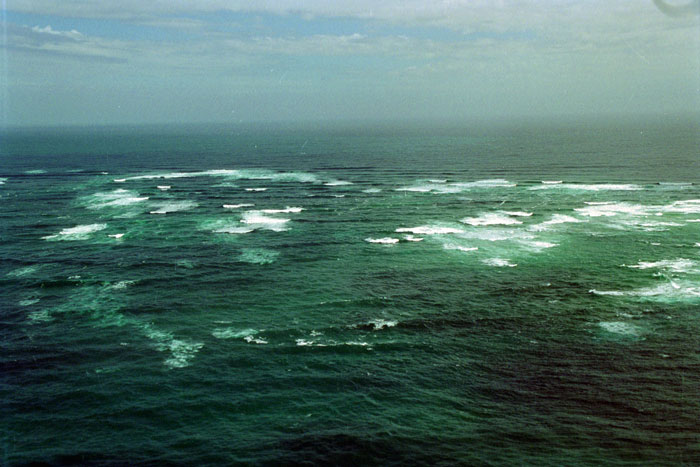
| The Tasman Sea and the
Pacific Ocean meet at Cape Reinga. The vectors of the bodies' wave
fronts meet at an angle. When the waves meet, sometimes they cancel
each other, sometimes they compound with spectacular results. |
| What's happening here? |
| The
Royal Australian Navy's
Directorate of Oceanography and Meteorology prepared this chart showing
the intersection of the East Australian Current (EAC) of the Tasman Sea and
the South Subtropical Current of the Pacific Ocean. Did you see
Finding Nemo?
Remember the 'Superhighway' that Marlin and Dory took to Sydney? That's the
EAC. |
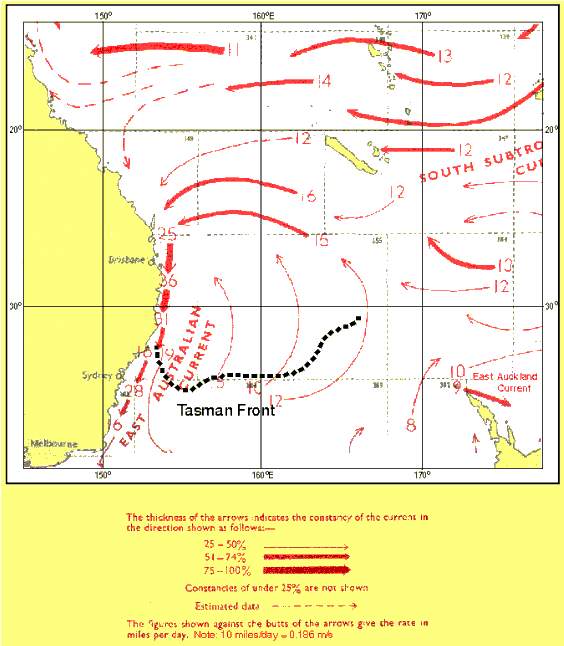 |
The EAC heads down the East
coast of Oz; some of it loops back across the Tasman Sea, reaching as far as
NZ, located in the lowest right portion of the chart. This is also
known as the Tasman Current or as part of the South Pacific Gyre.
Vector #8 shows the direction of this flow. It's heading north-north-east.
Look immediately above this at vectors 12 and 13. These are part of
the South Subtropical Current, and they head to the west. They collide
at Cape Reinga, which is at the #9 and #10. |
|
Source page for this graphic is here. |
| That's the Ocean currents.
There are also tidal currents, which cycle twice a day. |
| The
National Institute of
Water and Atmospheric research created this excellent .gif showing tidal
currents around the North Island. Keep in mind these are
just the tidal currents, caused by the rotation of the moon around
the earth. There's also the effects of wind, solar heating,
gravity, and Coriolis. |
|
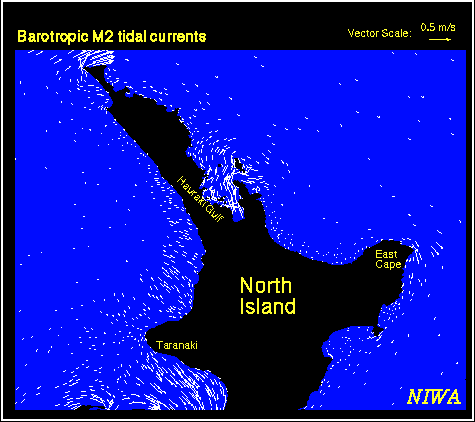 |
"Twice-daily M2
tidal currents around the North Island of New Zealand based on a TIDE2D
model. The currents at a model grid point are represented by a vector with
its length scaled to the current speed and the arrow points in the direction
of flow. Every 4th model grid point is plotted at ~1 hour intervals. Cape
Reinga is at the top of the North Island." To
simplify a bit, the longer the arrow, the faster the water is moving. Look
at what's happening at the very top of the North Island. |
|
|
| NIWA home page: |
|
 |
| |
| Page of origin for this
graphic: |
|
|
|
Here's one
way of figuring out where the currents go. |
| |
| |
| |
| |
|
 |
| |
| |
| |
|
|
| |
| |
|
|
| |
| |
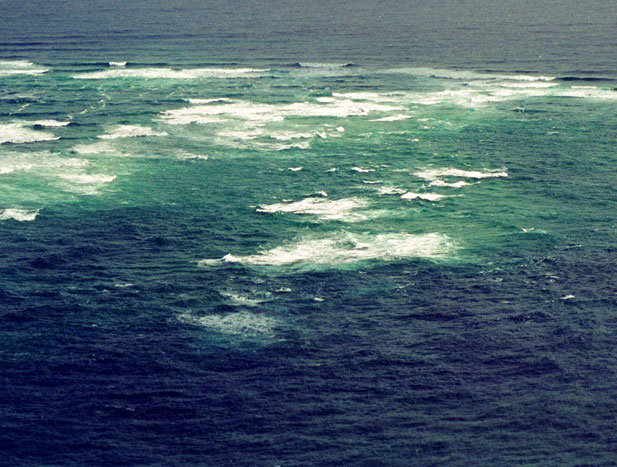
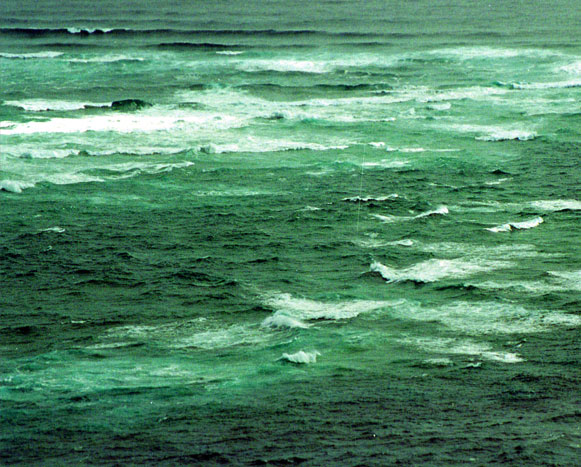
| Waves crashing to create
spray |
|
|
| |
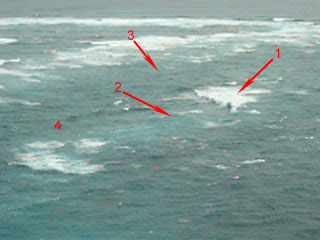
| a video of the waves from
Cape Reinga. Wave 1 is from the Pacific side. Wave 2, from the
Tasman side, crests shortly after wave 1 passes. Wave 3 appears after
wave 2 crests. Another collision appears at 4, creating a big plume. |
|
 |
| |
| |